“Our diversity,” according to Michelle Obama, “has been – and will always be – our greatest source of strength and pride here in the United States.”
What is now the United States has been diverse for more than 10 millennia. From the many tribal groups prior to first significant European contact to the migrations of different peoples here from all parts of Europe, Asia, Africa (predominantly as slaves at the beginning) our land and nation has always been a cauldron of diversity.
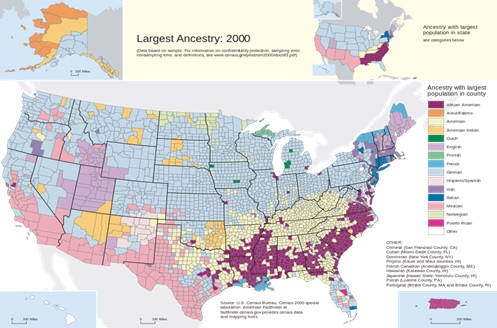
When the United States was instituted in 1789, its diversity was recognized by our founders. They opened the nation’s doors to the people of the world fleeing oppression. The map above demonstrates the modern face of that diversity. It shows the leading ethnic group of every county in the United States based on the 2000 Census.
The light blue color spreading from Pennsylvania across the Midwest to the Pacific shows German American dominance. It is the largest ethnic group in the nation. The pink color stretching across the nation’s southern border with segments running up though California and other Western states is, not surprisingly, Mexican American. In the Southeast and scattered large metropolitan counties, the dark purple color represents African Americans.
The light yellow color that runs through Appalachia and into the South are people who define themselves as “American.” This group is the only major group that doesn’t recognize an ancestry related to another area of the World or another epoch. Their ancestors are believed to have come primarily from England, Scotland, Ireland and Germany, generally during the 1600s and 1700s and totally intermingled so that when they are asked on a Census form 200 years later about their ancestry this is their correct answer. For them, America was a melting pot. This group, comprising about 10 percent of Americans, is the only group that doesn’t have a descriptive before or after their American identity
Looking at the map, you see that the other 94 percent of Americans, however, do recognize their ancestry. Up in New England you see English heritage as you might expect. But if you take your finger from there across the Mormon Trail you’ll see that Mormon Country in and around Utah is predominantly English heritage as well.
The golden color scattered about in Western states are counties where native Americans predominate on reservations. There are people with French heritage mostly in upper Maine and around New Orleans. And Irish and Italian Americans dominate in Boston and New York City and down though Long Island and New Jersey. Scandinavian and Dutch enclaves are scattered along the northern tier of the nation.
Cubans Americans are the leading group in South Florida and Japanese Americans hold sway in Hawaii. While Puerto Rico has its own color, that same color is growing in Central Florida.
This map, by just showing the leading ethnic group of every county in the nation, still only skims over the layers of diversity throughout the nation. In many cases the leading ethnic group of a county may be a small plurality of the county as a whole. Our large cities and metropolitan areas are stewpots of diversity where people whose ancestors came from everywhere on Earth mix and matchup in combinations to make new Americans combining gene pools from around the World.
While this map is a snapshot in time, the story of the making of the American People in all of our diversity has been dynamic over time. That’s the story that the National Museum of the American People will tell.
This blog is about the proposed National Museum of the American People which is about the making of the American People. The blog will be reporting regularly on a host of NMAP topics, American ethnic group histories, related museums, scholarship centered on the museum’s focus, relevant census and other demographic data, and pertinent political issues. The museum is a work in progress and we welcome thoughtful suggestions.
Sam Eskenazi, Director, Coalition for the National Museum of the American People
