#42: The 2020 Census and What It Means for the Future of the United States

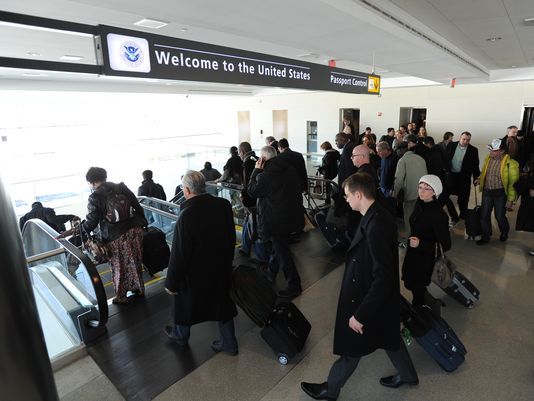
The National Museum of the American People, in telling the story about the making of the American People, will tell the story of how people came to be Americans through immigration and migration.

The 2020 Census found that 13.7% of the United States population was born in another country, a statistic that mirrors the numbers of the 1920 Census. In 1920, the foreign-born population was 13.1%. Over the decades, the percentage of the foreign-born population has fluctuated, and with it, the culture and social landscape of America have changed as well.

The US Census in 2020 gave a snapshot of the current American People

According to World Population Review, in 2020 the five countries that account for the most immigrants in the U.S. are Mexico, India, China, the Philippines, and El Salvador. This is a sharp contrast to what immigration looked like one hundred years ago. Between 1880 and 1920, most immigrants came from Europe.

While some have said that immigration damages our country by introducing incompatible ideas and conflicting cultures, the exact opposite is true. Yes, immigrants bring their customs, traditions, and different cultures with them when they come to a new nation, but that is not by any means a bad thing. The Europeans who came during that 1880 to 1920 surge also brought their diverse traditions and cultures with them.

Immigration has frequently been a contentious issue throughout US history. Anti-immigrant sentiments led to policies like the Chinese Exclusion Act, which banned Chinese immigrants from entering the country in 1882.

While resistance to immigration is nothing new, it is something that we, as a nation, should understand. Immigration is not something that the American People should fear; on the contrary, it is what makes this country so uniquely great. The growing number of foreign-born Americans is a sign of a bright future for our country.

As then-Senator Barack Obama said in his address to the 2004 Democratic National Convention, “There’s not a black America and white America and Latino America and Asian America; there’s the United States of America.”

The National Museum of the American People will embrace all of the American People.

Regardless of where we all come from, what cultures and customs we brought with us, and what traditions have been passed through our family’s from generation to generation. We are all Americans now.

#30: Irish Americans Are the 3rd Largest Ethnic Group in the US

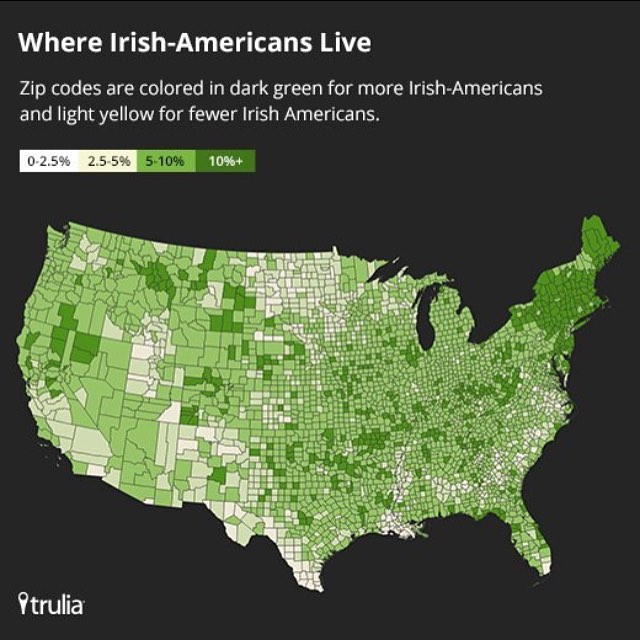
Irish Americans comprise a little more than 10 percent of the U.S. population and are the third largest ethnic group in the nation, and on St. Patrick’s Day it sometimes seems that half the nation makes a point of wearing something green to become Irish for the day.

At the National Museum of the American People the history of Irish Americans immigrating here and what they accomplished is one of the major stories that will be told.

More than 95 percent of the earliest immigrants from Ireland were Scots-Irish, essentially Scottish peoples who migrated to Northern Ireland before coming to America between 1717 and 1775. Their story will also be told in the Museum.

The first Irish Catholics to come in the 18th Century settled in Maryland and Pennsylvania. Later the Irish Famine of the 1840’s led to a much larger surge of Irish Catholics immigrating to the United States. They primarily settled in Northeast and Midwest port cities including Boston, Philadelphia, New York, Buffalo, Chicago, Pittsburgh, Baltimore, Detroit, Cleveland and St. Louis.

In the early part of the 19th Century Irish immigrants were among the largest participants on large scale infrastructure projects including canals and railroads. They moved west as those projects extended the U.S. reach in that direction.

While there were about 50,000 Irish immigrants in the 1820s and 207,000 in the 1830s, about 1.7 million came during the 1840s and 1850s. Another 1.9 million arrived over the rest of the 19th Century. Fewer than 1 million came during the 20th Century.

During the Civil War some 38 Union regiments had the word “Irish” in their title.

By 1910 there were more people of Irish ancestry in New York City than in Dublin. In the 2010 Census there were 35.5 million Irish in America ranking behind only German Americans and African Americans as the largest ethnic groups in the nation.

The National Museum of the American People will embrace the immigration and migration stories of all Americans, including the Irish and Scots-Irish who have come to our shores.

We wish a Happy St. Patrick’s Day to all of those who celebrate it.

This blog is about the proposed National Museum of the American People which is about the making of the American People. The blog will be reporting regularly on a host of NMAP topics, American ethnic group histories, related museums, scholarship centered on the museum’s focus, relevant census and other demographic data, and pertinent political issues. The museum is a work in progress and we welcome thoughtful suggestions.

Sam Eskenazi, Director, Coalition for the National Museum of the American People


#29: After 1924 US Doors Closed, Then Opened; Today Immigration Laws Are on America’s Front Burner

In our last few posts we’ve talked about immigration laws before the modern era. This blog discusses immigration laws over most of the 20th Century that have shaped the country we are now. During this period, coinciding with the 4th chapter of the National Museum of the American People’s story, the doors to the United States were all but closed to overseas immigrants in 1924, though the Indian Citizenship Act of that year granted U.S. citizenship to American Indians.

In 1929 as the Great Depression set in, Congress tightened overseas immigration even more by cutting the number of immigrants allowed annually to 150,000. It also linked a 2% nationality quota to the 1920 Census, limiting immigrants from eastern and southern Europe even more than at the end of the Museum’s  3rd Chapter.

Even without these harsher immigration laws, the Great Depression in the 1930s was slowing immigration to a trickle. During the deepest years of the Depression there were more people leaving the United States than entering it.

The political leanings of immigrants became an issue in the 1940s and 1950s. In 1940 the Alien Registration Act required all immigrants above age 13 to register with the government and be be fingerprinted, while it banned “subversives” from immigrating at all. The 1950 Internal Security Act allowed the U.S. to deport immigrants who were ever members of the Communist Party.

During World War II, the U.S. faced a shortage of farm workers and the so called Bracero Program was instituted in 1942 allowing Mexican manual laborers into the U.S. to work on farms. Over the following 22 years, about 5 million Mexican workers participated in the program.

Also during World War II the Chinese Exclusion Act was repealed though the annual quota was only 105 and in 1946 the repeal was extended to cover Filipinos and Indians.

In the immediate aftermath of the war, the War Brides Act was enacted in 1945 to allow alien spouses, natural children and adopted children of members of the Armed Forces to become citzens. More than 100,000 entered the U.S. via this route.

The war also led to a massive worldwide increase of refugees and the U.S. passed the Displaced Persons Act in 1948 allowing up to 200,000 refugees into the country. In 1952 the Immigration and Nationality Act consolidated earlier laws and eliminated race as a basis for exclusion. However the quota system remained in place and immigration remained at low levels.

The Immigration Act of 1965 changed all that. While annual immigration from overseas was limited to 170,000 with a maximum of 20,000 from any one country, and immigration from the Western Hemisphere was limited to 120,000, a preference system was established for family members of U.S. citizens and immigrants with special skills. Those two features had no numerical restrictions and led to a major increase in immigrants over subsequent decades.

Special laws were enacted to facilitate refugees from Cuba (1966) and then Vietnam, Cambodia and Laos (1975-76). In 1980 the Refugee Act was adopted to facilitate a variety of refugee issues around the world. Those fleeing their country on account of race, religion, nationality or politics were made a different category of immigrants and increased the number of people who could be admitted to the United States under this category.

A 1986 Immigration Reform Act gave those who entered the U.S. before 1982 a path to citizenship provided that they met a list of criteria. It also legalized certain seasonal agricultural undocumented immigrants, and made it illegal to knowingly hire or recruit undocumented immigrants.

Four years later, the Immigration Act of 1990 set an annual ceiling of 700,000 immigrants for three years and 675,000 after that. As the number of undocumented immigrants swelled during the 1990s, the Illegal Immigration Reform and Immigrant Responsibility Act of 1996 allowed deportation of immigrants for a wider range of crimes and applied the law retroactively. The number of Border Patrol agents was also increased.

Over the last two decades immigration has remained a major national political issue. The National Museum of the American People will be continuously updated to bring the story of the making of the American People up to date. In a future blog we will discuss immigration issues that have emerged in the 21st Century.

This blog is about the proposed National Museum of the American People which is about the making of the American People. The blog will be reporting regularly on a host of NMAP topics, American ethnic group histories, related museums, scholarship centered on the museum’s focus, relevant census and other demographic data, and pertinent political issues. The museum is a work in progress and we welcome thoughtful suggestions.

Sam Eskenazi, Director, Coalition for the National Museum of the American People

#23: 2010 Census Provides In-Depth Snapshot of US Diversity

While a map of the US showing the largest ethnic group of each county in the nation provides a broad brush view of our nation’s diversity, using actual census numbers provides a deeper window into our nation’s diversity.

Based on the 2010 Census, four groups, German American, African American, Irish American and Mexican American constitute about half of the nation’s population.

Adding English American, Italian American, Polish American, French American and those who simply say American, you get to about 75 percent of Americans. Some respondents selected more than one ancestry group or race.

Here are 33 of the largest ethnic groups based on the 2010 Census. Alaskan Native and Native Hawaiian are combined here with American Indians. The total population of the US in 2010 was 308.7 million. The National Museum of the American People expects to use the 2020 Census in bringing the story of the making of the American People up to the present.This blog is about the proposed National Museum of the American People which is about the making of the American People. The blog will be reporting regularly on a host of NMAP topics, American ethnic group histories, related museums, scholarship centered on the museum’s focus, relevant census and other demographic data, and pertinent political issues. The museum is a work in progress and we welcome thoughtful suggestions.
Sam Eskenazi, Director, Coalition for the National Museum of the American People